FOR TIPS, gUIDES & TUTORIALS

subscribe to our Youtube

GO TO YOUTUBE

14455 questions

17168 answers

28195 comments

0 members

We are migrating to our new platform at https://community.teltonika.lt. Moving forward, you can continue discussions on this new platform. This current platform will be temporarily maintained for reference purposes.
0 votes
521 views 0 comments
by anonymous

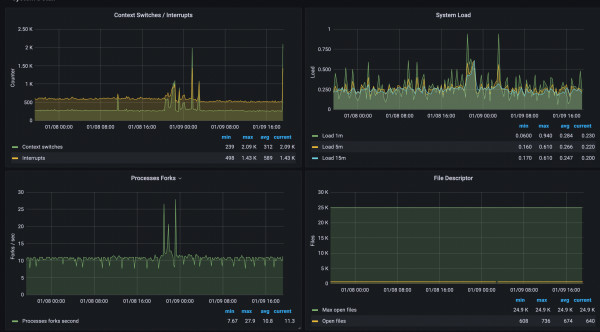
I have my RUTX11 configured with Prometheus to expose the :9100/metrics endpoint, which gets scraped and pushed into Grafana, and I can display the standard activity from the device (on a OpenWRT perspective), but what's missing, is all of the SMS, Mobile, radio data/signal data.

Is this data exposed somewhere else on the device that I can pull/poll and graph? The OID I get when I query it with snmpwalk gives me 1,480 lines of data, but it's not clear what data in that output, relates to the mobile signal/strength/radio/SIM data. How do I find that, so I can monitor and report on it? 

Thanks in advance!

1 Answer

0 votes
by anonymous

Hello,

snmpwalk -v 2c -c public 192.168.1.1 doesn't tell the complete story, snmpwalk -v 2c -c public 192.168.1.1 .1 will give you 100+ more lines, with at least part of the data you are looking for.

The complete list of values is here: https://wiki.teltonika-networks.com/view/RUTX11_SNMP

Regards,

Best answer