FOR TIPS, gUIDES & TUTORIALS

subscribe to our Youtube

GO TO YOUTUBE

13308 questions

15799 answers

25518 comments

50173 members

0 votes
20 views 1 comments
by

Hi,

In firmware R_00.07.03.01 i saw a always high (80-90%)CPU load in the overview page.
Althou i had no network activity running. So i thought the overview page value was off again.
At the time i was on my phone checking this, so no CLI "top" command was done to really check what was going on.
No info to be found either, so i decided to upgrade to the latest R_00.07.03.03.
I did still have this high CPU load condition in the overview page, althou everything was working fine (multicarrierheartsmiley)
Now i logged in with my laptop and executed the "top" command in CLI.
And the reported CPU level there was much lower than in the overview page. So perhaps there are still some bug to fix here?


\Patrik L

1 Answer

0 votes
by

Hello,

In addition to your tests, I have also included htop application.

All of them resulted in different evaluations. 
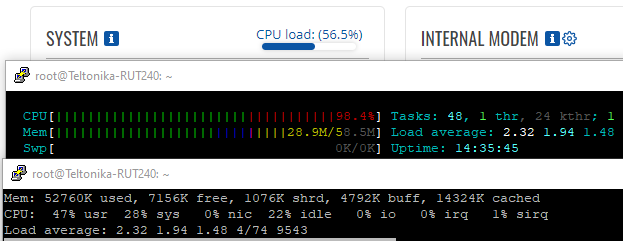
Since differences in CPU load seem to be quite significant at different instances of time, I would assume that the difference in results is simply a mismatch of data sampling.

Load average matches in all cases. 

Best regards,

by

Hi,

Ok, my overview CPU load shows constantly 70-90% when the combined load in CLI shows constantly around 15-30%.
But as long as the CLI values is what is actually happening regarding the CPU load, this is totally fine for me.yes
I just wanted to be sure when the CPU load is hitting 100% in the overview but not in the CLI, that the system is not restricting the performance.

\Patrik L