FOR TIPS, gUIDES & TUTORIALS

subscribe to our Youtube

GO TO YOUTUBE

14455 questions

17168 answers

28195 comments

0 members

We are migrating to our new platform at https://community.teltonika.lt. Moving forward, you can continue discussions on this new platform. This current platform will be temporarily maintained for reference purposes.
0 votes
107 views 0 comments
by anonymous
Is there a way to monitor traffic for a vlan on the RUTX11? I can see it can be set for lan or hotspot but doesn't appear to be able to be set for anything else.

Also, would it not be a good idea to have a gui for this even if its limited to troubleshooting eg show the last 200 entries only or something similar? I know it can be done with tcpdump to a certain extent but a gui in table format showing blocks & passes on the firewall would be benefical

1 Answer

0 votes
by anonymous

Hi,

While this is not currently available on the Teltonika devices, you can try using an OpenWrt package 'Darkstat'.

Connect to your device via CLI/SSH and execute the following commands:

  • opkg update
  • opkg install darkstat
  • vi /etc/config/darkstat

You will open a text editor. Press 'i' to start editing. Change the interface to reflect the name of your VLAN interface. For example, the VLAN interface is named vlan20 (and attached to eth0.20) with a network of 192.168.20.0/24.
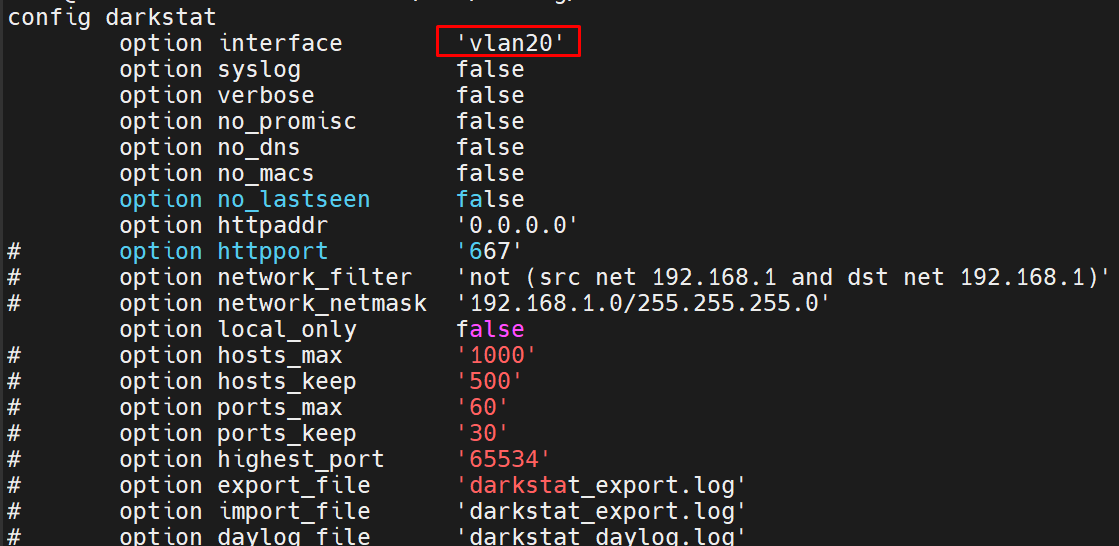
Save the script by pressing  'esc' button, typing ':wq' and pressing 'enter'

Start darkstat service via commands:

  • /etc/init.d/darkstat enable
  • /etc/init.d/darkstat start

Then, open your browser and connect to:

  • <Routers_LAN_or_VLAN_IP>:<darkstat_port

For example,

  • 192.168.1.1:667

Darkstat listens on port 667 by default. You should see network statistics for your VLAN.

You can find more information about the package here.

Kind Regards,

Andzej