FOR TIPS, gUIDES & TUTORIALS

subscribe to our Youtube

GO TO YOUTUBE

14455 questions

17168 answers

28195 comments

0 members

We are migrating to our new platform at https://community.teltonika.lt. Moving forward, you can continue discussions on this new platform. This current platform will be temporarily maintained for reference purposes.
0 votes
1,146 views 5 comments
by anonymous

I recently updated a couple of RUT240 from firmware 14.4 to 0.7.01 and immediately noticed a massive increase in CPU load and RAM usage, even if the 240 was pretty much idle.

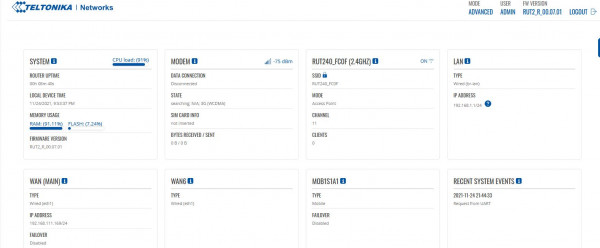
Under firmware 14.4, with a config set up, the CPU was at about 18% and RAM at 44%. In firmware 0.7.01, after a factory reset, the CPU hovers around 95% and RAM at 91%.

Interestingly, top shows different numbers, so its possible the overview isnt accurate (although the device was slow to respond when it had a config loaded??):

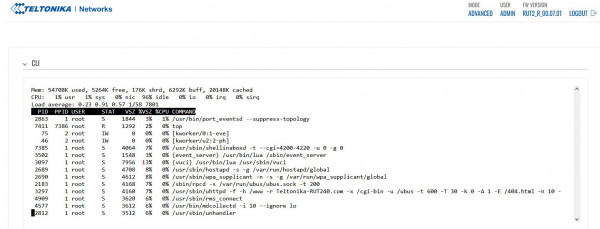
The CPU drops to around 20% over time, but the RAM remains at about 87%; quite high for a device at factory reset, so doing not much.

The overview numbers jump back up to about 90% when I loaded our OVPN config, and top indicated OVPN was using 61% CPU when transporting packets, while under firmware 14.4 it was using around 30%.

Why would the exact same config load for OVPN be so much heavier on CPU and RAM under 0.7.01??

by anonymous
I noticed the same thing, and other major problems too with 0.7.xx - see https://community.teltonika-networks.com/40152/upgraded-rut240-rut2_r_00-from-r_00-lost-modem-completely
by anonymous
I noticed quite the same.
Status Web gui show 94% and more for the CPU load but cli top between 2 and 6 percent ...
by anonymous
I noticed the same issue on at RUT950 router with FW. R_00.07.01.1

Rolling back to FW. R_00.07.00 seems to solve the issue. Going from CPU load 89% to 7% (fw. 7.01.1 - 7.00)

3 Answers

0 votes
by anonymous
Hi,

Unfortunately the attached snap's are blurry so can you please share it and the below requested logs together for analysis for the high load check as well to verify the difference in parameter values being seen on different views.

1> Scenario 1 : post factory reset of the RUT and idle : GUI overview screenshot, kernel log, system log (copy paste onto a notepad), troubleshoot, tcpdump files and "top" command output from the cli.

2> Scenario 2 : post ovpn config load : GUI overview screenshot, kernel log, system log (copy paste onto a notepad), troubleshoot file and tcpdump files and "top" command output from the cli.

Thanks
by anonymous
Hi; thanks for your response.
 I couldnt see how to attach a file to the comment area of the question, so decided to PM you.
I've attached the files you requested post factory reset, except for the TCP Dump as doing that from the router wasnt possible as far as I could see.
I havent added the files with our config, as they would include too much of our security settings like certs etc. Hopefully the post reset files, where the router should be basically idle will answer your questions.
I also included the 2 screenshots form my first post
Thanks for looking into this problem.
0 votes
by anonymous
Hi,

Thank you for sharing the files, I shall check and get back to you asap.

Thanks
by anonymous
Hi there. Just wondering about progress on this issue?

Thanks.
+1 vote
by anonymous
Hi,

Apologies for the delay in response, Post checks with our RnD team it has been determined that there are few cosmetic errors in the values being displayed thus the difference seen on the CPU usage levels. This is currently being addressed.

Thanks